Interpreting Test Results
DISCLAIMER: THIS WEBSITE DOES NOT PROVIDE MEDICAL ADVICE
The information on this site is not intended or implied to be a substitute for professional medical advice, diagnosis or treatment. All content, including text, graphics, images and information, contained on or available through this web site is for general information purposes only. Always seek the advice of your physician or other qualified health care provider with any questions you may have regarding a medical condition or your personal health data provided here.
How to interpret your A1C?
The A1C test—also known as the hemoglobin A1C or HbA1c test—is a simple blood test that measures your average blood sugar levels over the past 3 months. Higher A1C levels are linked to diabetes complications. If you have diabetes, reaching and maintaining your individual A1C goal is really important, which means monitoring blood sugar levels over time. A normal A1C level is below 5.7% (or, little-to-no risk of diabetes), a level of 5.7% to 6.4% indicates prediabetes (or, a higher risk of developing diabetes in the future), and a level of 6.5% or more indicates diabetes. Within the 5.7% to 6.4% prediabetes range, the higher your A1C level, the greater your risk is for developing type 2 diabetes. Type 2 diabetes is influenced by lifestyle choices like diet and exercise, although some people are also genetically at risk. This means that if your family members have diabetes, you may have a higher chance to develop diabetes. A1C is an important tool for managing diabetes, but it doesn’t replace regular blood sugar testing at home for patients who already have type 2 diabetes or that have type 1 diabetes. For example, blood sugar goes up and down throughout the day and night, which isn’t captured by your A1C results. Two different people can have the same A1C level, one with steady blood sugar levels and the other with high and low swings.
How do you lower your A1C?
The best person to help you with your A1C is your doctor. Your doctor knows all your conditions and can better advise you on how to reduce your A1C levels if you have type 2 diabetes or pre-diabetes. Remember that avoiding sugar, having a diet high in fiber and low in carbohydrates, and exercising often (at least 30 minutes per day) can reduce your risk of developing type 2 diabetes and also improve your health overall.
How to interpret your Body Mass Index (BMI)?
Body Mass Index is a useful measure for your health in terms of your relative size. It is calculated from your height and weight, dividing your weight in kilograms by your height in meters squared (m2). BMI is an estimate of body fat and a good gauge of your risk for chronic diseases that can occur when more body fat is present. The higher your BMI, the higher your risk for diseases such as heart disease, high blood pressure, type 2 diabetes, gallstones, breathing problems, and certain cancers. BMI is intended as a tool for adults only, as children and adolescents are constantly growing so their weight-to-height ratios follow different patterns than adults who have achieved their full height. In considering your BMI, it’s important to consider your personal circumstances. Specifically, BMI may overestimate body fat in athletes and others who have a muscular build, while it may underestimate body fat in older persons and others who have lost muscle. Additionally, the ethnic and genetic background can influence the association between your BMI and health risks.
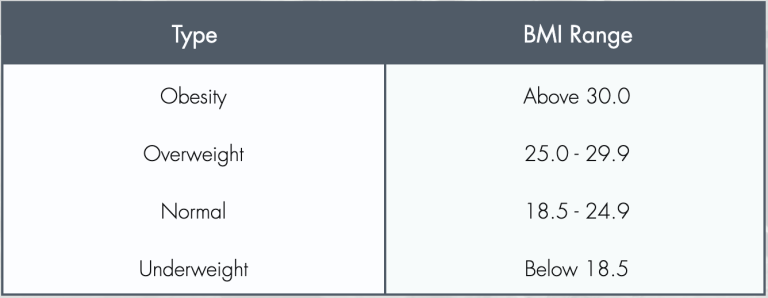
The guide values for BMI are:

You should try to stay within the normal range. If you need help losing or gaining weight, you should talk with your doctor. Only your doctor has access to all your health measurements and can advise you on how to improve your BMI in a healthy way for you.
How to interpret your Gut Microbiome results?
The Gut Microbiome and Diversity
The characteristics of a healthy microbiome are still being teased apart by researchers, but one factor is agreed upon – a diverse microbiome community is generally healthier than a less diverse one. This is because having a wide variety of microbes can make your microbiome more capable and resilient.1
When we consider the capacity of a microbiome, we are referring to its many functions that sustain human health. Throughout our life these microbes influence a range of physiological processes that work locally and systemically. Examples of localized effects include helping digest foods,2 optimizing nutrient absorption,3 and protecting our intestinal organs.4 Systemically, our microbiomes are involved in copious interactions that include influencing our immune systems,5 helping control our mood, 6 and impacting our cognitive performance.6 If you have a diverse microbiome, it’s likely that these microbes are working synergistically and separately to uphold the many processes necessary to maintain your health.
We also care about the resilience of the microbes in our gut because exposures throughout our life can also impact our microbes detrimentally. Some environmental factors that can disrupt your microbes include unhealthy diets,7 pollution,8 smoking,9 and medications.10 If your microbiome is more diverse, you are less susceptible to the negative impact these exposures have on your microbiome.11
There are a few different metrics currently used to measure microbial diversity. One of the more commonly preferred methods is by calculating alpha diversity.
What is Alpha Diversity?
Rather than focusing on which exact species are present in your microbiome, your alpha diversity score can tell you about the broader make-up of your microbiome. Alpha diversity takes into account how many different kinds of species are present (richness) and then compares the abundance of each of these species (evenness) within your microbiome.12
The collective diversity scores we have observed from our community-based studies on Oʻahu range from 1.04 to 4.52.
The Risk of Low Microbial Diversity
The reason why we care to measure the diversity of our microbiomes is because many studies have found when people are sick they tend to have lower diversity scores. In fact, a majority of chronic diseases have a co-occurrence with lower gut diversity.13 Just a few examples of well described microbiome-linked diseases include obesity,14 inflammatory bowel diseases,15 type II diabetes,16 cardiovascular disease,17 neurological disorders,18 and even various forms of cancer.19-21
Your diversity score can help give some insight about your risk of developing these diseases in the future. However, if you find yourself on the lower end of the diversity scale this does not mean you will develop these diseases. And opposingly, if you find your diversity score is higher on the scale, this does not mean you can never develop any of these diseases. These scores are made available to you to better understand the current state of your microbiome. Remember – our microbiomes are largely a product of our diet; to enhance and maintain a healthy microbiome it is essential to consume fiber from fresh foods like fruits and vegetables throughout your life.22
External Resources
- Dogra SK, Doré J, Damak S. Gut Microbiota Resilience: Definition, Link to Health and Strategies for Intervention. Front Microbiol. 2020;11. Accessed September 8, 2022. https://www.frontiersin.org/articles/10.3389/fmicb.2020.572921
- Oliphant K, Allen-Vercoe E. Macronutrient metabolism by the human gut microbiome: major fermentation by-products and their impact on host health. Microbiome. 2019;7(1):91. doi:10.1186/s40168-019-0704-8
- Krajmalnik-Brown R, Ilhan ZE, Kang DW, DiBaise JK. Effects of Gut Microbes on Nutrient Absorption and Energy Regulation. Nutr Clin Pract Off Publ Am Soc Parenter Enter Nutr. 2012;27(2):201-214. doi:10.1177/0884533611436116
- Vos WM de, Tilg H, Hul MV, Cani PD. Gut microbiome and health: mechanistic insights. Gut. 2022;71(5):1020-1032. doi:10.1136/gutjnl-2021-326789
- Zheng D, Liwinski T, Elinav E. Interaction between microbiota and immunity in health and disease. Cell Res. 2020;30(6):492- 506. doi:10.1038/s41422-020-0332-7
- Appleton J. The Gut-Brain Axis: Influence of Microbiota on Mood and Mental Health. Integr Med Clin J. 2018;17(4):28-32.
- Statovci D, Aguilera M, MacSharry J, Melgar S. The Impact of Western Diet and Nutrients on the Microbiota and Immune Response at Mucosal Interfaces. Front Immunol. 2017;8. Accessed September 8, 2022. https://www.frontiersin.org/articles/10.3389/fimmu.2017.00838
- Fouladi F, Bailey MJ, Patterson WB, et al. Air pollution exposure is associated with the gut microbiome as revealed by shotgun metagenomic sequencing. Environ Int. 2020;138:105604. doi:10.1016/j.envint.2020.105604
- Gui X, Yang Z, Li MD. Effect of Cigarette Smoke on Gut Microbiota: State of Knowledge. Front Physiol. 2021;12. Accessed September 8, 2022. https://www.frontiersin.org/articles/10.3389/fphys.2021.673341
- Weersma RK, Zhernakova A, Fu J. Interaction between drugs and the gut microbiome. Gut. 2020;69(8):1510-1519. doi:10.1136/gutjnl-2019-320204
- Lozupone CA, Stombaugh JI, Gordon JI, Jansson JK, Knight R. Diversity, stability and resilience of the human gut microbiota. Nature. 2012;489(7415):220-230. doi:10.1038/nature11550
- Willis AD. Rarefaction, Alpha Diversity, and Statistics. Front Microbiol. 2019;10. Accessed September 8, 2022. https://www.frontiersin.org/articles/10.3389/fmicb.2019.02407
- Vijay A, Valdes AM. Role of the gut microbiome in chronic diseases: a narrative review. Eur J Clin Nutr. 2022;76(4):489-501. doi:10.1038/s41430-021-00991-6
- Davis CD. The Gut Microbiome and Its Role in Obesity. Nutr Today. 2016;51(4):167-174. doi:10.1097/NT.0000000000000167
- Nishida A, Inoue R, Inatomi O, Bamba S, Naito Y, Andoh A. Gut microbiota in the pathogenesis of inflammatory bowel disease. Clin J Gastroenterol. 2018;11(1):1-10. doi:10.1007/s12328-017-0813-5
- Cunningham AL, Stephens JW, Harris DA. Gut microbiota influence in type 2 diabetes mellitus (T2DM). Gut Pathog. 2021;13(1):50. doi:10.1186/s13099-021-00446-0
- Murphy K, O’Donovan AN, Caplice NM, Ross RP, Stanton C. Exploring the Gut Microbiota and Cardiovascular Disease. Metabolites. 2021;11(8):493. doi:10.3390/metabo11080493
- The role of microbiome in central nervous system disorders – ClinicalKey. Accessed September 8, 2022. https://www-clinicalkey-com.eres.library.manoa.hawaii.edu/#!/content/playContent/1-s2.0-S0889159113006004?returnurl=https:%2F%2Flinkinghub.elsevier.com%2Fretrieve%2Fpii%2FS0889159113006004%3Fshowall%3Dtrue&referrer=https:%2F%2Fpubmed.ncbi.nlm.nih.gov%2F
- He T, Cheng X, Xing C. The gut microbial diversity of colon cancer patients and the clinical significance. Bioengineered. 12(1):7046-7060. doi:10.1080/21655979.2021.1972077
- Ruo SW, Alkayyali T, Win M, et al. Role of Gut Microbiota Dysbiosis in Breast Cancer and Novel Approaches in Prevention, Diagnosis, and Treatment. Cureus. 13(8):e17472. doi:10.7759/cureus.17472
- Ahn J, Chen CY, Hayes RB. Oral microbiome and oral and gastrointestinal cancer risk. Cancer Causes Control CCC. 2012;23(3):399-404. doi:10.1007/s10552-011-9892-7
- Tap J, Furet JP, Bensaada M, et al. Gut microbiota richness promotes its stability upon increased dietary fibre intake in healthy adults. Environ Microbiol. 2015;17(12):4954-4964. doi:10.1111/1462-2920.13006
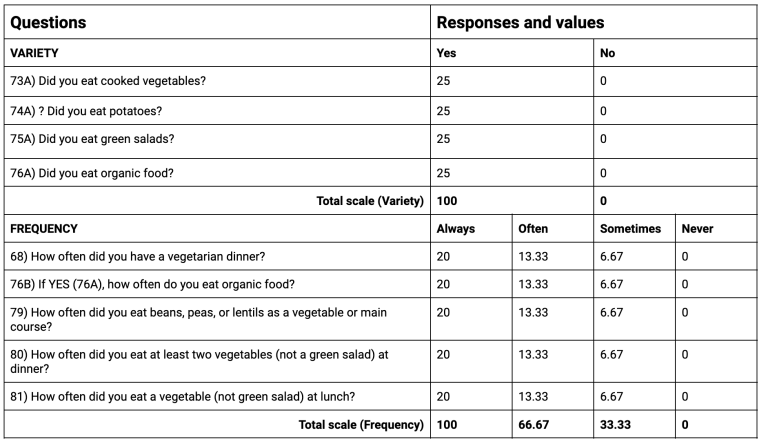
Vegetable Consumption Indices for Variety and Frequency
Vegetable intake was measured using two indices: “Variety” and “Frequency.” Each index was comprised of several survey questions, which are outlined in the following table, along with their possible scores. Each index is scored on a scale of 1 to 100.

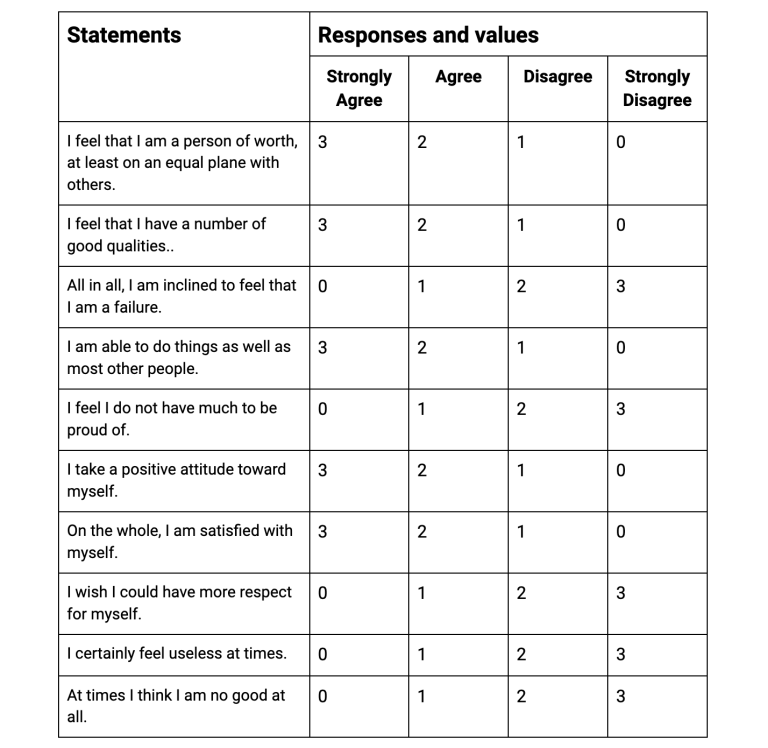
Rosenberg's Self-Esteem Scale
Participants responded to the ten statements in the table below, with responses ranging from “strongly agree” to “strongly disagree.” Responses are scored with a possible range from 0-30. Scores between 15 and 25 are within normal range; scores below 15 suggest low self-esteem.


